Sub-seasonal coupling between surface temperature and Top-of-Atmosphere radiative imbalance

A Causality-Based View of the Interaction between Synoptic- and Planetary-Scale Atmospheric Disturbances
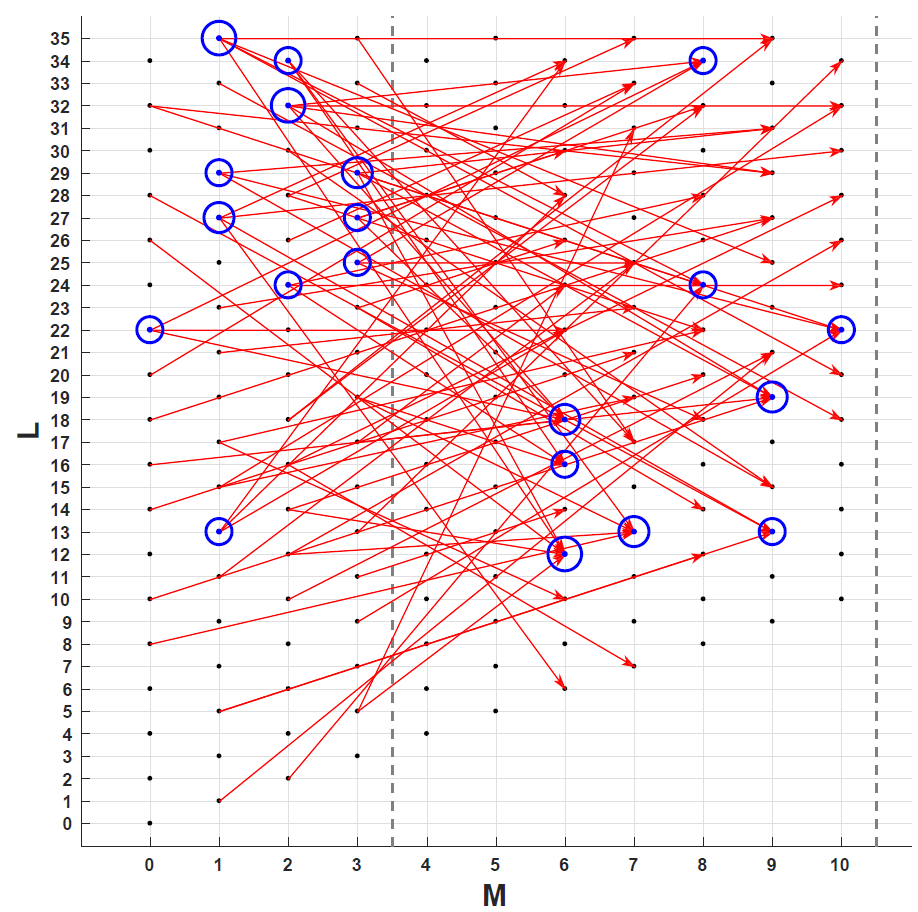

Flow of information from planetary-scale to synoptic-scale disturbances (left) and from synoptic-scale to planetary-scale disturbances (right). The results are based on boreal winter Northern Hemisphere 500mb geopotential height data in the NCEP-NCAR Reanalysis for the period 1948-2016. M and L are respectively zonal wavenumber and total wavenumber following a spherical harmonics expansion.
Causal Relationship among Atmospheric Teleconnections and Causal-Discovery-Based Climate Networks
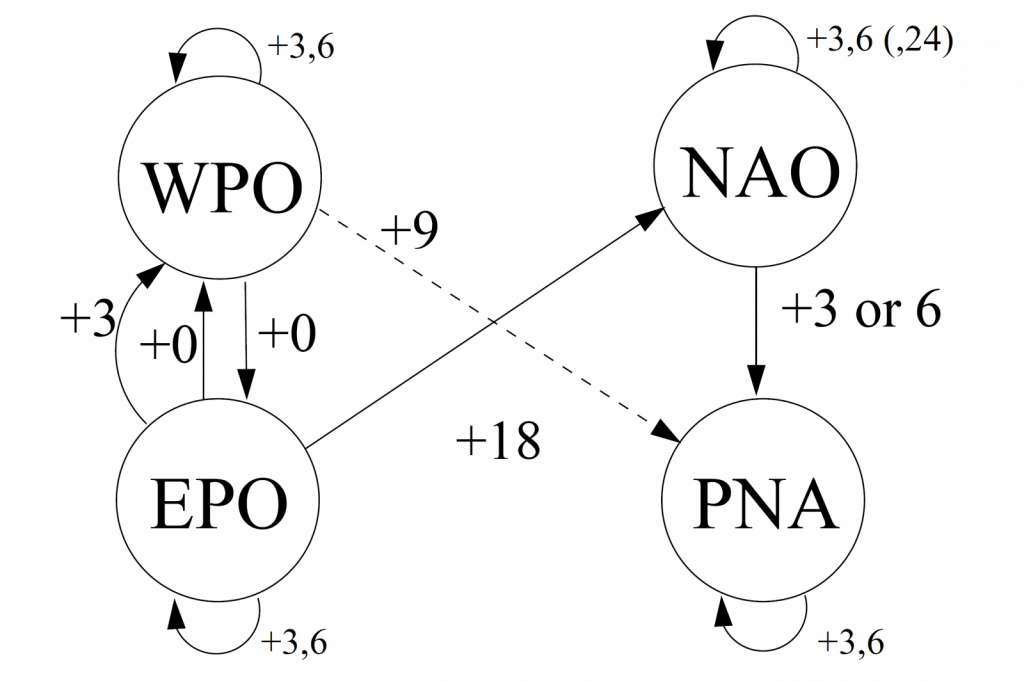
This project seeks to recover cause-effect relationships from observational/reanalysis data using graphical models. We have applied causal discovery methods, particularly constraint-based structure learning to understanding the dynamical interactions among four prominent modes of atmospheric low-frequency variability in boreal winter including the Western Pacific Oscillation (WPO), Eastern Pacific Oscillation (EPO), Pacific North America Pattern (PNA) and North Atlantic Oscillation (NAO). The role of ENSO in these interactions is also examined. The results are shown as static and temporal independence graphs also known as Bayesian Networks. Ongoing efforts include the construction of a new type of climate network based on cause-effect-relation (information flow) in the atmosphere.

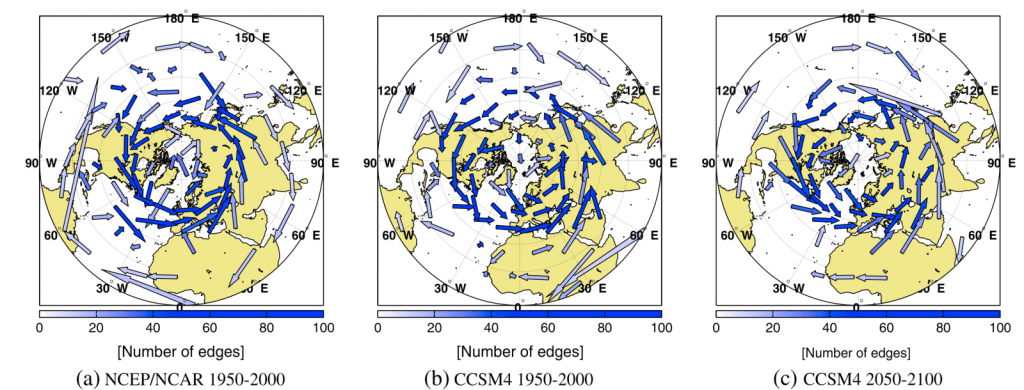
The average velocity of information low (in km/day) at 500 mb for boreal winter derived from (a) NCEP/NCAR reanalysis for the period 1950-2000, (b) NCAR CCSM4 model’s 20th century climate simulation for the period 1950-2000, and (c) CCSM4’s 21st century climate projection for the period 2050-2100 under the RCP8.5 forcing scenario. The model is capable of capturing most features of the atmospheric information flow, e.g., concentrated, eastward directed flow of information in the extratropics and much sparse, westward directed flow of information in the tropics. Under enhanced greenhouse gases forcing, prominent mid-latitude information pathways in the mid-troposphere weaken and shift poleward and major tropical information pathways start diminishing. Averaged over the entire Northern Hemisphere, the atmospheric information flow weakens.