Radiative and Dynamical Feedbacks in ENSO variablity: Observations versus CMIP5 Models
Our analysis of ENSO variability in CMIP5 models reveals that while in the sense of the multi-model ensemble mean the ENSO-related surface and atmospheric temperature anomalies are generally captured by the CMIP5 models, the feedback attribution results (i.e., the relative contributions of various radiative and dynamical processes to the total temperature anomaly) are quite different between model simulation and observations. For example, cloud feedback in the tropical mid-troposphere (0.5 sigma level) has opposite signs in the model compared to observation. For example, water vapor feedback in the model has opposite signs and much greater magnitude compared to observation over the tropical-subtropical Pacific in the upper troposphere and lower stratosphere region (0.1 sigma level). This problem stands out more as we examine individual CMIP5 models. Figures below show for each CMIP5 model under investigation the contribution of individual feedback processes (vertical axis) to the total ENSO-related surface temperature anomaly (horizontal axis) over the equatorial Pacific and the extratropical Pacific-North American (PNA) region, respectively. It is clear that even through the model ensemble mean (empty circle) shows good agreement with observation (filled circle), substantial differences exist among models. Furthermore, the agreement between model ensemble mean and observation completely breaks down over the PNA region, where major inter-model differences are also present. This analysis demonstrates that many CMIP5 models are simulating “realistic-looking” ENSO for wrong reasons, in many cases, due to compensating errors in representing individual radiative and dynamical processes. Such misrepresented interannual variability by CMIP5 models is potentially a major obstacle for producing reasonable decadal climate predictions with these models.

The contributions of the partial temperature anomalies due to 5 processes (surface dynamics, water vapor feedback, cloud feedback, atmospheric dynamical feedback, and albedo feedback) to the total surface temperature anomaly associated with El Nino over the equatorial Pacific in observation (ERA Interim) and in 15 CMIP5 models.
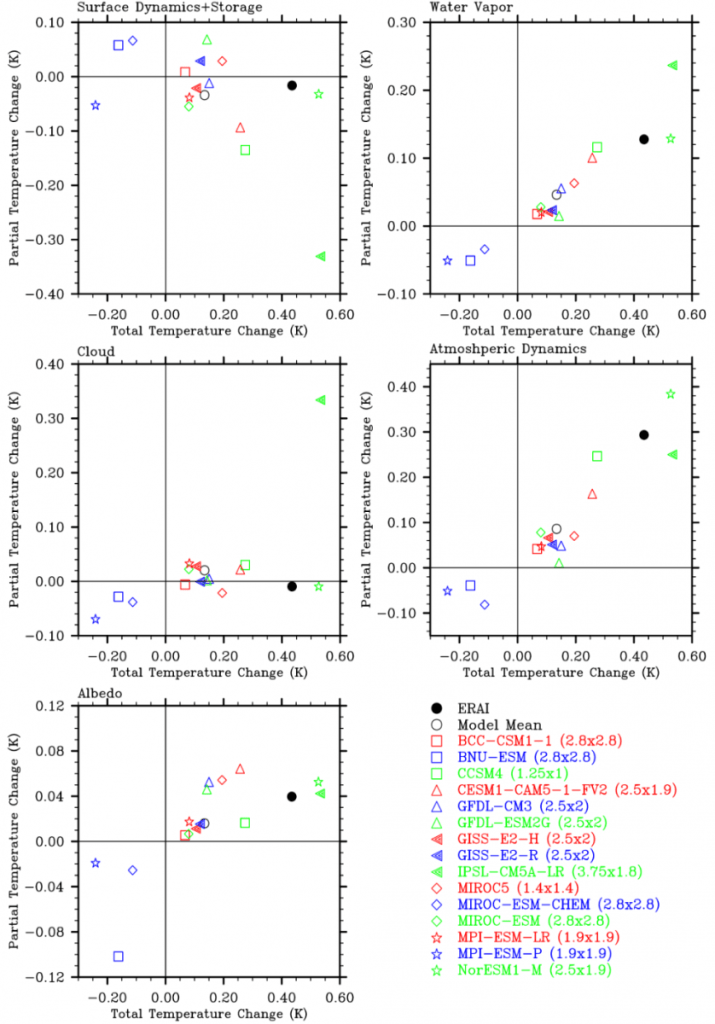
The contributions of the partial temperature anomalies due to 5 processes (surface dynamics, water vapor feedback, cloud feedback, atmospheric dynamical feedback, and albedo feedback) to the total surface temperature anomaly associated with El Nino over the extratropical Pacific-North American (PNA) in observation (ERA Interim) and in 15 CMIP5 models.
A Process-Based Assessment of Decadal-Scale Surface Temperature Evolutions in the NCAR CCSM4’s 25-Year Hindcast Experiments
This study represents an initial effort in the context of the coupled atmosphere-surface climate feedback-response analysis method (CFRAM) to partition the temporal evolution of the global surface temperature from 1981 to 2005 into components associated with individual radiative and non-radiative (dynamical) processes in the NCAR CCSM4’s decadal hindcasts. When compared with the observation (ERA-Interim), the CCSM4 is able to predict an overall warming trend as well as the transient cooling occurring during the period 1989-1994. However, while the model captures fairly well the positive contributions of the CO2 and surface albedo change to the temperature evolution, it has an overly strong water vapor effect that dictates the temperature evolution in the hindcast. This is in contrast with the ERA-Interim where changes in surface dynamics (mainly ocean circulation and heat content change) dominates the actual temperature evolution. Atmospheric dynamics in both the ERA-Interim and model works against the surface temperature tendency through turbulent and convective heat transport, leading to an overall negative contribution to the evolution of the surface temperature. Impacts of solar forcing and ozone change on the surface temperature change are relatively weak during this period. The magnitude of cloud effect is considerably smaller compared to that in the ERA-Interim and the spatial distribution of the cloud effect is also significantly different between the two especially over the equatorial Pacific.


Observed (left) and CCM4 hindcast (right) of the global surface temperature differences (K) (with respect to the 1981-85 base state) averaged over all the 5-year segments except for the 1981-85 one: (a) the sum of partial temperature differences (K) derived from the CFRAM, and partial temperature differences (K) due to changes in (b) solar irradiance, (c) ozone, (d) CO2, (e) water vapor, (f) albedo, (g) clouds, (h) surface dynamics, and (i) atmospheric dynamics. The values on the upper right of the figure panels denote the global mean values and the curves on the right of the panels denote the meridional profiles of the zonally averaged values.
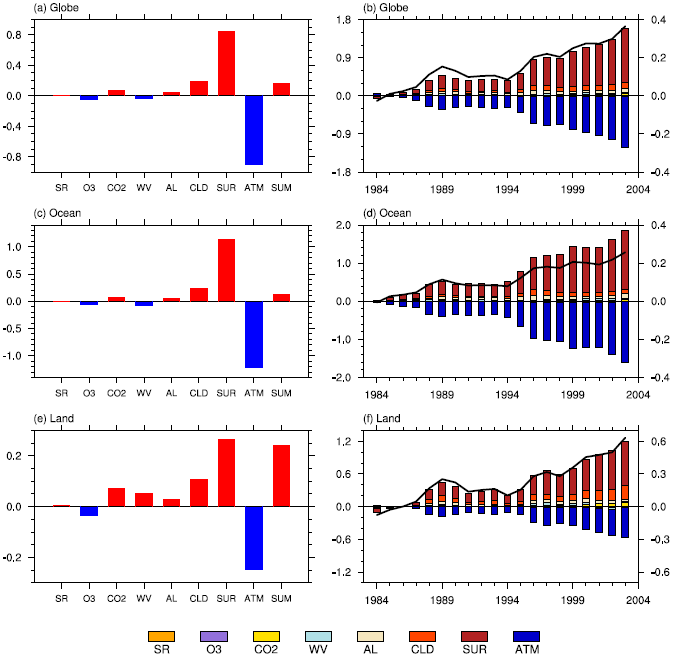

Left figure (ERA Interim), right figure (CCSM4 hindcast). In each figure, left panels: temporal pattern-amplitude projection (PAP) coefficients (K) associated with the eight partial temperature differences shown in Figs. 2b-2i) and their sums over the (a) globe, (c) ocean, and (e) land. Right panels: temporal evolution of the spatial PAP coefficients (K, refer to the left Y coordinate) associated with the same eight processes and their sums (solid black curves, refer to the right Y coordinate) over the (b) globe, (d) ocean, and (f) land. The abbreviation “SR”, “O3”, “CO2”, “WV”, “AL”, “CLD”, “SUR”, “ATM” and “SUM” stand for solar irradiance, ozone, CO2, water vapor, surface albedo, cloud, surface dynamics, atmospheric dynamics, and the sum, respectively.