Dynamical and Statistical Characterization of United States Extreme Precipitation Events and their Associated Large-Scale Meteorological Patterns
The primary regional patterns of extreme precipitation events occurring over the continental United States are identified via hierarchical cluster analysis of observed daily precipitation for the period 1950-2005. Six canonical extreme precipitation patterns (EPPs) are isolated for the boreal warm season and five for the cool season. The large-scale meteorological pattern (LMP) inducing each EPP is identified and used to create a “base function” for evaluating a climate model’s potential for accurately representing the different patterns of precipitation extremes. A parallel analysis of the Community Climate System Model, version 4 (CCSM4) reveals that the CCSM4 successfully captures the main US EPPs for both the warm and cool seasons, albeit with varying degrees of accuracy. The model’s skill in simulating each EPP tends to be positively correlated with its capability in representing the associated LMP. Model bias in the occurrence frequency of a governing LMP is directly related to the frequency bias in the corresponding EPP. In addition, however, discrepancies are found between the CCSM4’s representation of LMPs and EPPs over regions such as the western US and Midwest, where topographic precipitation influences and organized convection are prominent, respectively. In these cases, the model representation of finer scale physical processes appears to be at least equally important compared to the LMPs in driving the occurrence of extreme precipitation.
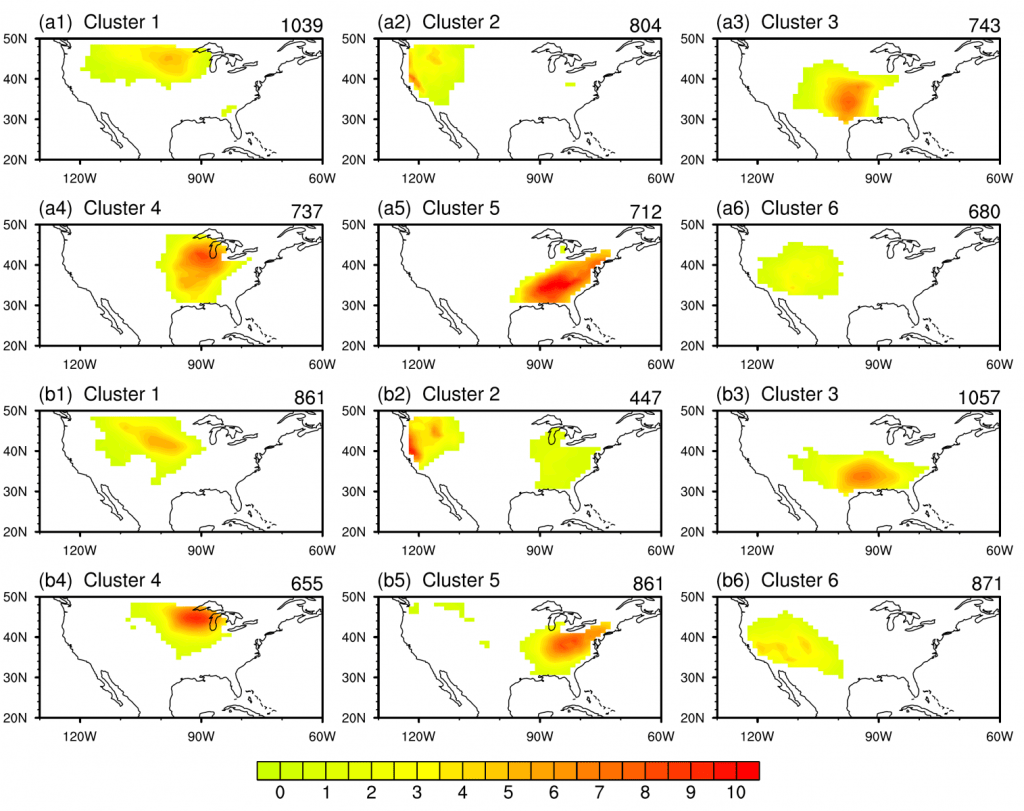
Composite daily precipitation anomalies (unit: mm/day ) for the six warm season extreme precipitation clusters identified in the observation during the period 1950-2005 (a1-a6). b1-b6 are the counterpart results obtained from the CCSM4 historical climate simulation. Only values significant at the 0.01 level are plotted. The number shown at the upper right of the figure is the occurrence frequency.
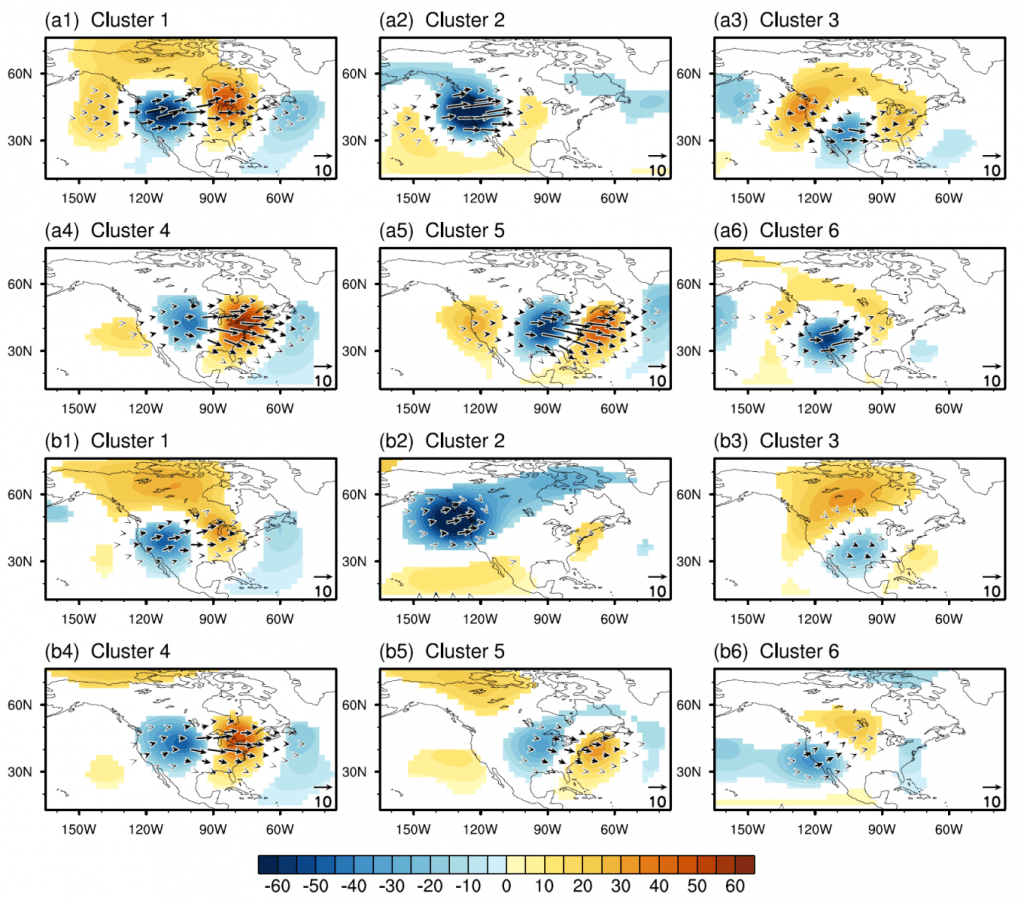
Composite daily geopotential height anomalies (color shading, unit: m) and wave-activity flux (W) (vectors, unit: m2s-2) at 500 hPa for the six warm season extreme precipitation clusters identified in the observation (a1-a6). b1-b6 are the counterpart results obtained from the CCSM4 historical climate simulation. Only values significant at the 0.01 level are plotted.
Warm Season Dry Spells in the Central and Eastern United States: Diverging Skill in Climate Model Representation
Warm season dry spells over the central and eastern United States are classified into three canonical types via a hierarchical cluster analysis for the period 1950-2005. Four CMIP5 models exhibit diverging skill in representing the observed behavior: ranging from southern Great Plains dry spells that are reasonably simulated by all four models to southeastern U.S. dry spells that are only accurately captured by one model. A model’s skill in representing a particular dry spell cluster is positively correlated with the model’s ability to simulate the large-scale meteorological patterns (LMPs) accompanying the dry spell. The interannual variability and overall observed decreasing trend in dry spell days are represented with varying degrees of accuracy by the four models. The results (a) highlight existing shortcomings in the climate model representation of regional dry spells and (b) illustrate the importance of properly simulating the observed spectrum of LMPs in minimizing these shortcomings.
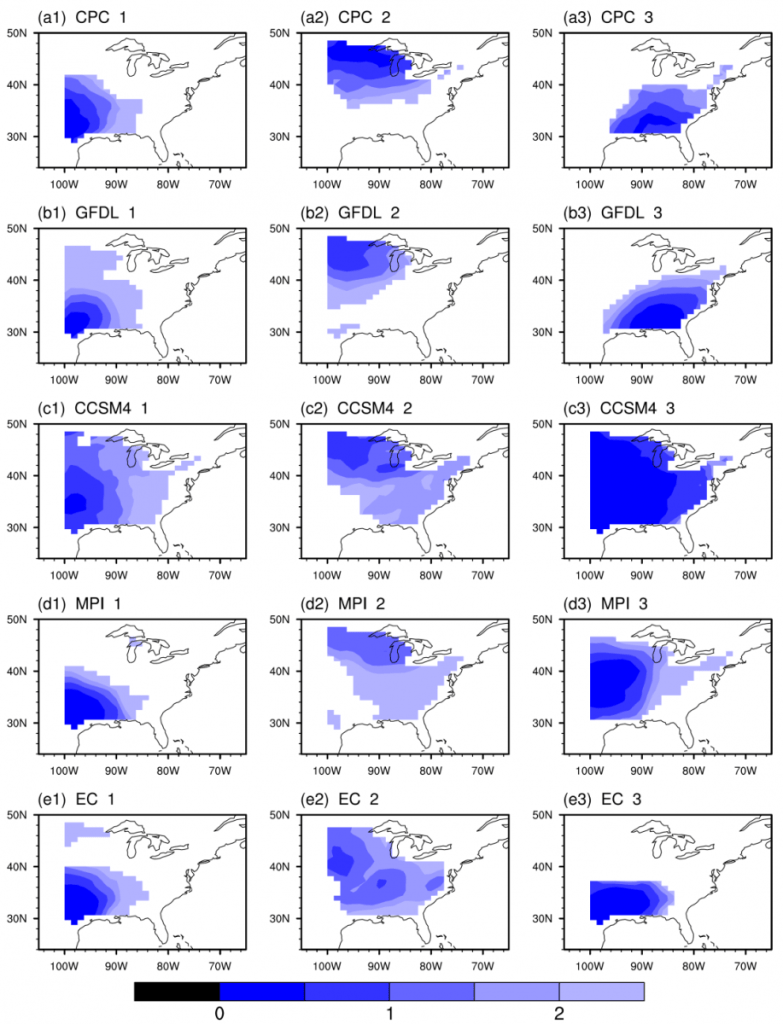
Composite daily precipitation rate (unit: mm/day) for the three warm season dry spells clusters identified in the observation during the period 1950-2005 (a1-a3). b1-b3, c1-c3, d1-d3, and e1-e3 are the counterpart results obtained from the GFDL-CM3, CCSM4, MPI-ESM-MR, and EC-EARTH historical climate simulations, respectively. Only values significant at the 0.01 level are plotted.

The trend slope (x-axis, unit: ) and interannual variability (y-axis, unit: ) for the total and each of the three warm season dry spells clusters identified in the observation and four models’ (i.e., the GFDL-CM3, CCSM4, MPI-ESM-MR, and EC-EARTH) historical simulations. Only solid circles are significant at the 0.05 level.
Multi-Scale Temporospatial Variability of the East Asian Meiyu-Baiu Fronts – Characterization with a Suite of New Objective Indices
The Meiyu-Baiu front (MBF) is the primary weather system modulating the monsoonal rainfall in East Asia, and it exhibits pronounced variability across multiple temporal and spatial scales. A suite of new objective indices based upon daily reanalysis data are developed to characterize such variability, which include an “intensity” index effectively measuring the meridional gradient of equivalent potential temperature across the frontal zone, a “location” index documenting the central latitude and longitude of the front, and a “stationarity” index corresponding to the standard deviation of the daily central latitude. All these indices are characterized by strong interannual to interdecadal variations. Specifically, the MBF has shown a tendency of southwestward shift since the mid-1990s and become more stationary over southern China with reduced intraseasonal meandering. The western North Pacific subtropical high (WNPSH) is the main circulation feature affecting the location of the MBF on interannual timescales. The MBF moves northward (southward) when the WNPSH is anomalously strong (weak) and the surface high over the region of 35°-50°N/100°-120°E is anomalously weak (strong). When the WNPSH is strong, the MBF is often situated northwest to its climatological position and becomes more stationary. On interdecadal timescales, enhanced activity of high latitude blocking over East Asia is often accompanied with a stronger but less stationary MBF while a negative phase of the Arctic Oscillation favors a southward-shifted and more stationary MBF.
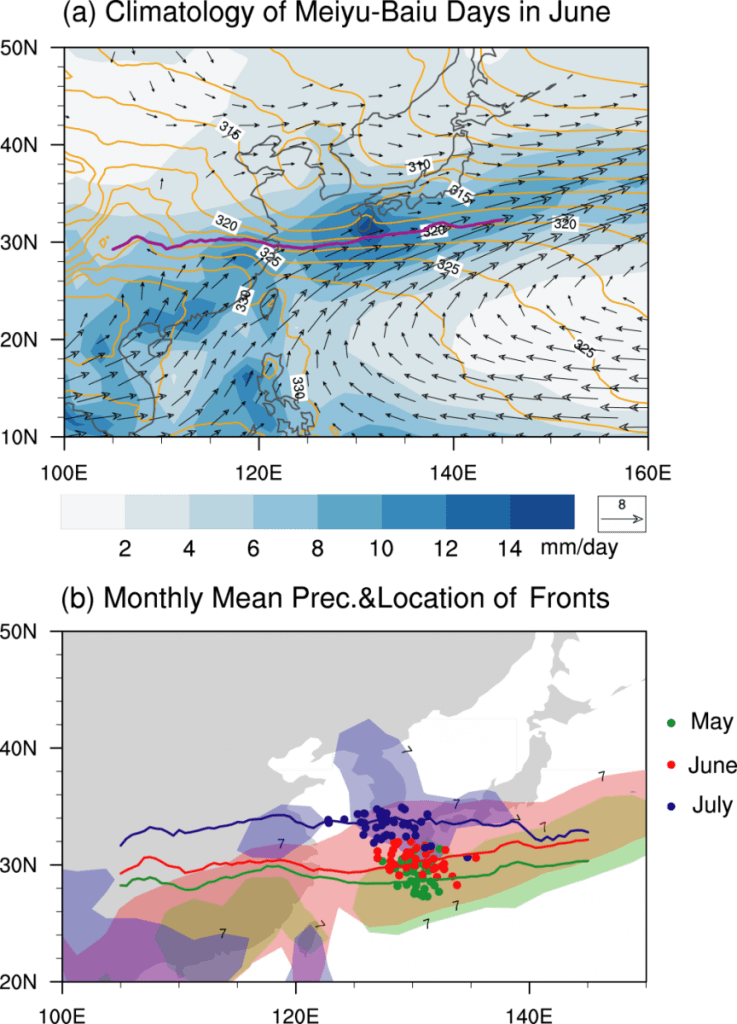
(a) Monthly mean precipitation (shading; mm/day), 850-hPa winds (vectors; m/s) and 850-hPa equivalent potential temperature (contours; K) of MBF days in June averaged for the period 1979-2016, where the purple line refers to the climatological mean location of MBF in June. (b) Monthly mean precipitation (shading; >7 mm/day) and monthly mean locations of MBFs (solid lines) in May, June and July averaged for the period 1979-2016, where the dots denote the central location of the MBF in each year.

Time-series of the May-June-July (MJJ) mean characteristics of the MBF for the period 1979-2016: (a) the intensity (K/km), (b) the central longitudes (°E), (c) the central latitudes (°N), and (d) the stationarity (°N) of the MBF in each year. In each plot, red dash lines represent the 5-yr running mean.