Hindcasting the Madden Julian Oscillation with a New Parameterization of Surface Heat Fluxes
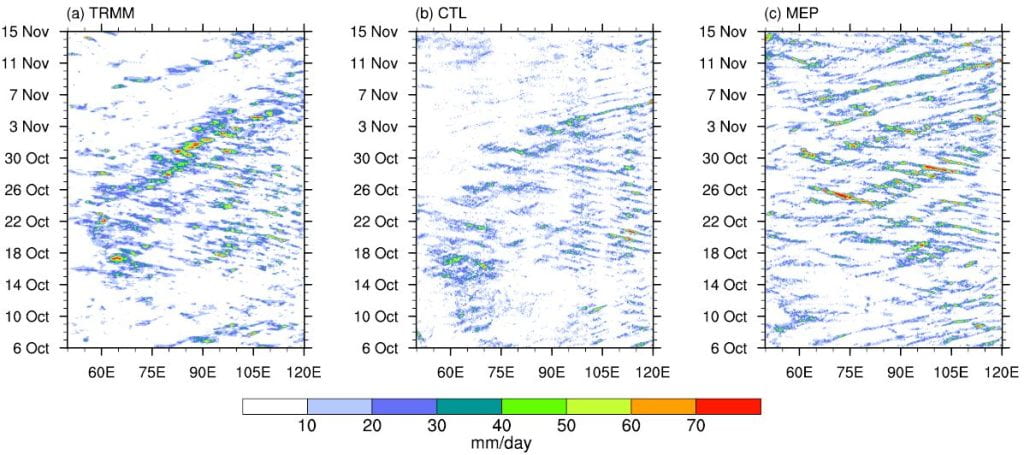
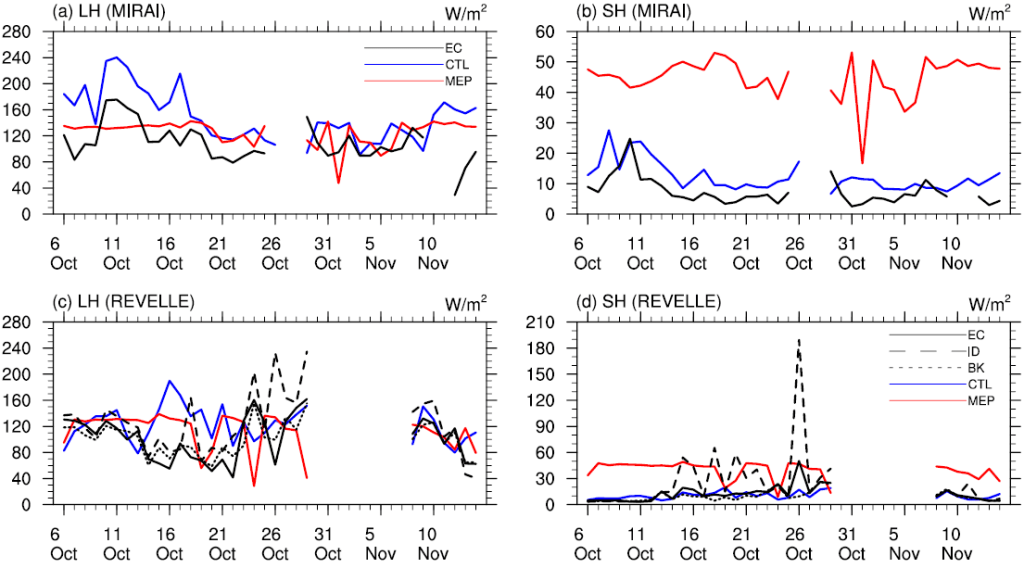
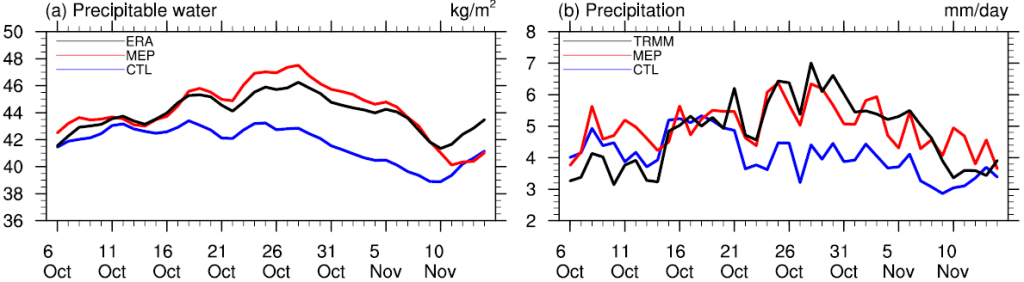
The recently developed maximum entropy production (MEP) model, an alternative parameterization of surface heat fluxes, is incorporated into the Weather Research and Forecasting Model (WRF). A pair of WRF cloud-resolving experiments (5 km grids) using the bulk transfer model (WRF default) and the MEP model of surface heat fluxes are performed to hindcast the October Madden–Julian oscillation (MJO) event observed during the 2011 Dynamics of the MJO (DYNAMO) field campaign. The simulated surface latent and sensible heat fluxes in the MEP and bulk transfer model runs are in general consistent with in-situ observations from two research vessels. Compared to the bulk transfer model, the convection envelope is strengthened in the MEP run and shows a more coherent propagation over the Maritime Continent. The simulated precipitable water in the MEP run is in closer agreement with the observations. Precipitation in the MEP run is enhanced during the active phase of the MJO with significantly reduced regional dry and wet biases. Large-scale ocean evaporation is stronger in the MEP run leading to stronger boundary layer moistening to the east of the convection center, which facilitates the eastward propagation of the MJO.